Make a slide illustration that explains one idea
A beautiful slide image can leave the audience no wiser. Ask AI for a visual that explains the relationship you mean, then check what the metaphor accidentally implies.
Example output
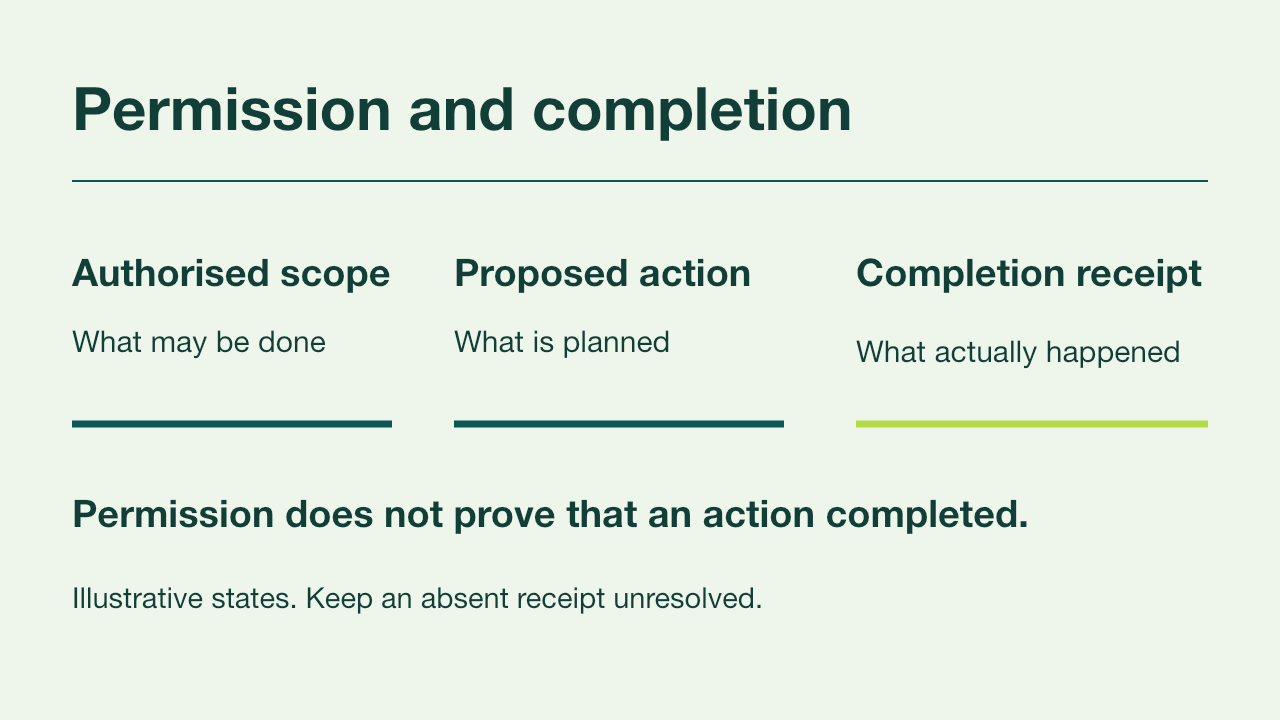
A one-idea slide with editable labels
Example slide: new customers move to the new price on 1 January; existing customers move at renewal.
Read the prompt
Propose three visual mechanisms for one slide explaining [exact idea]
to [audience], using [supplied source facts]. For each, state what the
viewer should understand and what the visual must not imply.
Prefer a diagram, comparison or concrete transformation when it explains
the relationship. Avoid decorative AI symbols and unsupported claims.
Keep the final wording and factual labels editable outside image artwork.
Do not generate a whole deck before I select the mechanism.What you'll make
one slide whose visual explains a single idea, with every label, date and number kept as editable text.
What you'll need
the one sentence the slide must explain, the facts behind it and the tool you present from: PowerPoint with Copilot, Google Slides with Gemini, or Canva. Claude or ChatGPT can also draft a .pptx file. Allow about 20 minutes.
1. Ask for three ways to show one relationship
Before asking for any picture, write the idea as a sentence with a relationship in it. “The new price applies to new customers from 1 January; existing customers keep theirs until renewal” is something you can draw. “Our pricing update” is a topic, and a topic gets a stock photo of a price tag.
Then ask for distinct mechanisms, not three decorative styles of the same picture. Use Claude, ChatGPT, the Copilot pane in PowerPoint or Ask Gemini in Google Slides.
Propose three visual mechanisms for one slide explaining [idea]
to [audience], using only these facts: [facts].
For each, say what the viewer should understand and what the visual
must not imply. Prefer a diagram, comparison or concrete
before-and-after over decorative symbols. Keep every label, number
and date as editable text, not part of an image.
Don't build the slide or a deck until I choose one.
[idea] is your one sentence. [audience] is who will see the slide. [facts] are the dates, figures and exceptions the slide has to respect.
Why this works: asking what each visual must not imply makes the model name the risk before you’re charmed by the picture.
What you should see: three genuinely different layouts, such as a timeline, a split comparison and a metaphor, each with a short “understand” line and a “must not imply” line.
2. Choose by meaning, not polish
Read each “must not imply” line against your facts, then look at the layout itself. Does it show the relationship, or does it only suggest progress, speed or excitement? A rocket implies growth when the source only says who pays what and when. A trophy suggests success before any result exists. A glowing brain implies nothing at all, at some expense.
Pick the mechanism that keeps every condition visible in the picture. If someone could glance at it and miss the exception, choose a more literal one.
Why this works: the audience remembers the picture, not the caption. A condition that lives only in small print will be forgotten by Tuesday.
What you should see: one mechanism whose picture still tells the right story when you cover all the text.
3. Build it with editable labels
Build the slide in the tool you present from:
- PowerPoint: open the Copilot pane and ask for one slide, or build the chosen layout from shapes and text boxes yourself.
- Google Slides: click Ask Gemini at the top right, or Insert › Help me create a slide, then click Insert to add the result.
- Canva: build the layout from text and shape elements, and use generated images for decoration only.
- Claude or ChatGPT: ask for a .pptx file, then open it in PowerPoint or Slides.
Use mechanism [number]. Build one slide titled [title] with these
labels: [labels]. Keep every word, number, date and arrow as editable
text or shapes. Use an illustration only where it carries no fact.
Add a one-sentence speaker note that explains the idea for someone
who can't see the slide.
[number] is the mechanism you chose, [title] the slide title and [labels] the exact words that must appear.
Why this works: text baked into an image can’t be corrected, translated or read by a screen reader. Text boxes and shapes can.
What you should see: a slide where clicking a label lets you edit it, plus a speaker note.
Check the result
- Click every label, date and number. Each should be a text box or a shape, not part of a picture.
- Cover the text and look at the visual alone. It should still say what your one sentence says.
- Find every condition from your facts on the slide: dates, who it applies to and any exceptions.
- Shrink the window to presentation size. The smallest label should still be readable from the back of the room.
The usual failure: the visual drops the condition. A change that applies to some people becomes a rising arrow for everyone, and the exception survives only as a footnote, or not at all. To spot it, ignore the words and ask who the picture says is affected.
The visual implies [wrong reading]. The facts say only [idea].
Change the visual so the condition is part of the picture, not a
footnote. Keep the layout and every label editable, and don't add
claims about growth, speed or success.
[wrong reading] is what the picture says when you ignore the words.
Worked example: the new-customer price slide
Fictional example. An account team at Larchfield, a software company, needs one slide for Monday’s customer-success meeting.
Idea: The new price applies to new customers from 1 January 2027.
Existing customers keep their current price until their renewal date.
Facts: new price £18 per user per month; current price £15.
Renewals fall throughout the year. No existing price changes before renewal.
Audience: 12 account managers who will answer customer questions.
The step 1 prompt returned three mechanisms:
| Mechanism | Viewer should understand | Must not imply |
|---|---|---|
| Two-lane timeline | New customers pay £18 from 1 January; existing customers move at renewal | That everyone changes on 1 January |
| Rising price arrow, £15 to £18 | Prices are going up | (left blank) |
| Split card: new and existing | Two groups, two rules | That existing customers never change |
The arrow was the cleanest picture, and the model left its “must not imply” line empty. Covered up, it told every account manager that all their customers pay £18 on 1 January. The new-customer rule had shrunk to a footnote: the usual failure.
The team ran the repair prompt with the wrong reading “every customer pays £18 from 1 January” and the idea from the data block. The revised slide used the timeline: a top lane, “New customers: £18 from 1 January 2027”, and a bottom lane, “Existing customers: £15 until renewal, then £18”, with renewal markers spread across the year.
- The empty “must not imply” line was the warning. A mechanism that can’t name its risk usually is the risk.
- The markers are spread out because renewals are. A single marker on 1 January would have repeated the error in a quieter way.
- Every label is a text box, so if the price becomes £19 next week, it’s a click rather than a new image.
Try it
Choose the mechanism that keeps the exception
Choose the visual mechanism that shows who the price change applies to.
The picture has to carry the condition. If the visual alone says everyone pays more on 1 January, the slide is wrong, whatever the footnote says.
Task kit for this job: Download (ZIP) · Reusable instructions
Go deeper
Keep one slide to one idea
If the visual needs several unrelated qualifications, it’s carrying more than one idea. Split it into two slides, or move the detail into a short memo the audience can read later. Don’t ask AI to make a crowded slide clearer by shrinking the text; that only makes the footnote problem official.
Write the description before the picture
A slide that explains a relationship is a complex image, so it needs a short alternative text and a fuller description nearby. Writing that description first is also a good test of the idea: if you can’t say it in two sentences, the visual won’t either.
Write a short alternative text (under 20 words) and a two-sentence
description for this slide. Describe the relationship it shows, not
its colours or layout. Flag anything in the visual the description
cannot support.
Reuse the method, not the metaphor
Next time, replace the idea and the facts, then ask for three mechanisms again. A favourite metaphor that worked for one slide will quietly imply the wrong thing on the next. For infographics and longer explainers, the source-led explanation guide uses the same habit at a larger scale.
Sources
- Create a new presentation with Copilot in PowerPoint (Microsoft Support)
- Collaborate with Gemini in Google Slides (Google Docs Editors Help)
- Create and edit files with Claude (Claude Help Center)
- Work with files in ChatGPT (OpenAI)
- Complex images (W3C Web Accessibility Initiative)